
Successfully Incorporating Visuals into Online Training: Part One - Graphics
Sarah Flesher
One great thing about developing online training is that you can add a variety of media to your course. Two of the most important types of media available to you are graphics and video. But, do you know how to use them effectively? Even better, do you know what type of graphic or video to use and when?
In this two-part series, I will take a closer look at each of these mediums, describe the different types of each and their uses. Let's begin with graphics.
Graphic Types and How to Use Them
In his article, 7 Ways to Use Graphics for Learning, Mike Taylor describes seven types of graphics:
- Decorative
- Representational
- Mnemonic
- Organizational
- Relational
- Transformational
- Interpretive
Let's take a quick look at each type of graphic and talk about how and when it should be used.
Decorative Graphics
Decorative graphics are, well, decorative. They dress up a screen and hopefully complement the onscreen text. They are possibly the most common and most overused type of graphic in training materials. They are supposed to complement text or emphasize learning points, but, more often than not, they detract from the learning content.
In the 1980s, PowerPoint was the biggest thing in creating training presentations and every slide needed a graphic to make it "pop". That attitude and the use of "eye candy" graphics migrated to Computer-based Training or CBT, the ancient ancestor of eLearning. Graphics were custom-designed or copy-and-pasted from any available source with no regard for copyright. Now, with companies such as iStock and Getty Images offering licensed affordable images of everything under the sun, the use of decorative graphics is easy and, regrettably, rampant.
I have to agree with what Tadej Stanic says about decorative graphics in his article "4 Rules for Using Graphics in eLearning". Stay away from them or use them sparingly if you must use them at all.
Representational Graphics
As the name suggests, representational graphics are used to show what something looks like. A picture of a specific fish or one of a finished dish accompanying a recipe are perfect examples of this type of graphic and of how they should be used.
Representational graphics are best used to illustrate concrete concepts (e.g. hammering a nail) or to help demonstrate information (e.g. photo of moldy cheese). They have a real purpose and are not just for colour or entertainment. Use them generously in task-related eLearning, especially when describing how to use equipment, forms and manual processes.
Mnemonic Graphics
Mnemonic graphics are designed as memory aids. One look and the learner is reminded of a concept, process or procedure. Two basic types of mnemonic devices used in graphics are:
- Acronym - a word made up of the first letters of things in a group to help remember them. A common example is HOMES to remember the names of the great lakes (Huron, Ontario, Michigan, Erie, Superior).
- Acrostic - a sentence made up of words where each word starts with the first letter of an item in a group of things. "Many very energetic men just stay until nine" can be used to remember the correct order of the names of the planets in the solar system (Mercury, Venus, Earth, Mars, Jupiter, Saturn, Uranus, Neptune).
While mnemonic devices are generally used in learning materials for school-aged children, they can be used with a graphic to illustrate steps in a workplace procedure.
Organizational Graphics
I like using organizational graphics as breadcrumbs to indicate directions on an individualized learning path. You can use learning path images to show learners where they've been, where they are and where they need to go.
I also like using organizational graphics to illustrate qualitative relationships such as workflows or hierarchies. In these cases, you can be creative and insert text pop-ups or videos within each picture used in the graphic to further explain the concept. In 7 Ways to Use Graphics for Learning, Mike Taylor used this graphic to show us an example of an organizational graphic.
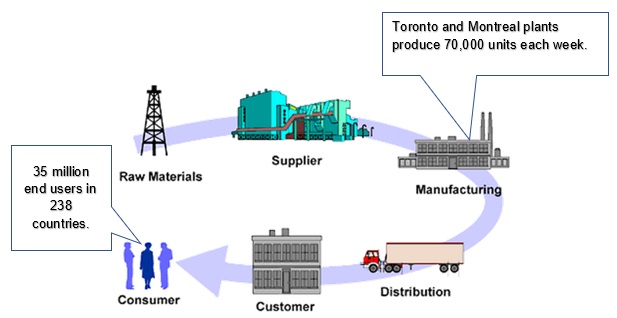
Source: 7 Ways to Use Graphics for Learning, Mike Taylor, eLearnng Heroes
Now, imagine how much more effective this graphic would be if the learner was able to click on each image and explanatory text or a video would appear. I've added callouts to the graphic to show you what I mean.
Relational Graphics
Relational graphics are charts and graphs. While they may not be the most exciting, they most certainly have their purpose. Where appropriate, use lots of colour to make an impact. But don't lose sight of the message in these graphics. It's the numbers and what they represent that are most important.
Transformational Graphics
As the name implies, this type of graphic is used to show transformations, or changes. These can be movement through space or changes over periods of time. Transformational graphics lend themselves well to animation. This image of a caterpillar changing into a butterfly has been used on dozens of websites and is a perfect example of a transformational graphic.

Source: LinkedIn
Interpretive Graphics
Examples of interpretive graphics are schematic diagrams, cutaways or cross-sectional photos that demonstrate theories or principles in operation. These can range from a simple wiring diagram to an animation of the human circulatory system. They show how things work and are very effective training tools. Shown here is a diagram of a hydrogen internal combustion engine.

Source: ResearchGate
eLearning Graphics Tips
- Don't ignore your audience - even though you may think that a dinosaur or fluffy bunny graphic would be great, keep your audience in mind. What visual would make the content more relevant to them and to their workplace?
- Don't use eye candy graphics - keep it relevant to the material. Don't use graphics for the sake of having to have a graphic on each page.
- Enhance the learning experience - use graphics with text wherever possible and appropriate.
- Incorporate text into the graphic when possible - use textboxes, callouts and pop-ups to make graphics come alive through interaction.
Conclusion
Well, I hope that I wasn't too "graphic".
Seriously, there's a lot to consider as you incorporate graphics into online training. Done with care and with the learner in mind, properly used graphics enhance the content and help to drive home the learning points.
In this article, I've talked about how to effectively incorporate graphics into your eLearning. Next time, we'll explore how to do the same with video. In the meantime, for more great tips on using graphics, read "4 Rules for Using Graphics in eLearning" by Tadej Stanic.

Free eBook
Learning Resource Development: The Basics
Learn how to create accessible content, choose the right voice, incorporate meaningful graphics, and more!
📘 Ready to Elevate Your Learning Strategy?
Explore our comprehensive library of eBooks and tools on learning resource development, competency-based learning, and LMS implementation. Transform your training programs with insights from industry experts and practical templates.

Sarah Flesher
Sarah is an Instructional Designer at BaseCorp Learning Systems and is currently completing a PhD in Educational Technology. Her research focuses on implementing competency-based learning systems in all types of organizations. When she doesn't have her nose in a book you can find her at the gym, on the ice, on the ski hill, drinking wine or in a coffee shop … with her nose in a book.